Top 30
Cars with the worst UK MOT suspension failure rate
Sorted by total suspension-defect count divided by total tests. 1,000-test minimum.
- 01

 35.4%
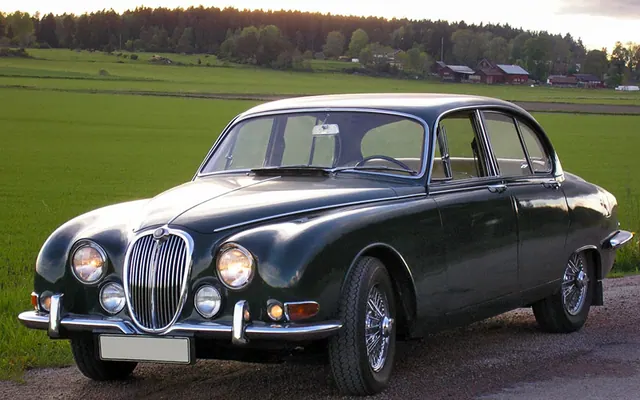
35.4%Jaguar S Type
23,764 tests · 94,209 avg mi · 69.1% pass
Suspension faults account for 35.4% of the S Type's MOT tests, across a fleet averaging 94k miles. The most common recorded suspension failures are a torn suspension dust cover and a missing suspension dust cover. A first-time pass rate of 69.1% and a 4.0% pass-after-rectification rate together suggest suspension faults here are often caught and sorted rather than terminal.
- 02

 29.1%
29.1%Chrysler Jeep Patriot
1,298 tests · 106,517 avg mi · 60.3% pass
Suspension faults account for 29.1% of the Patriot's MOT tests, across a fleet averaging 107k miles. The most common recorded suspension failures are worn suspension bushes and The strength or continuity of the load bearing structure within 30cm of any sub-frame, spring or suspension component mounting (a 'prescribed area') is significantly reduced or inadequately repaired. A first-time pass rate of 60.3% and a 4.9% pass-after-rectification rate together suggest suspension faults here are often caught and sorted rather than terminal.
- 03

 28.1%
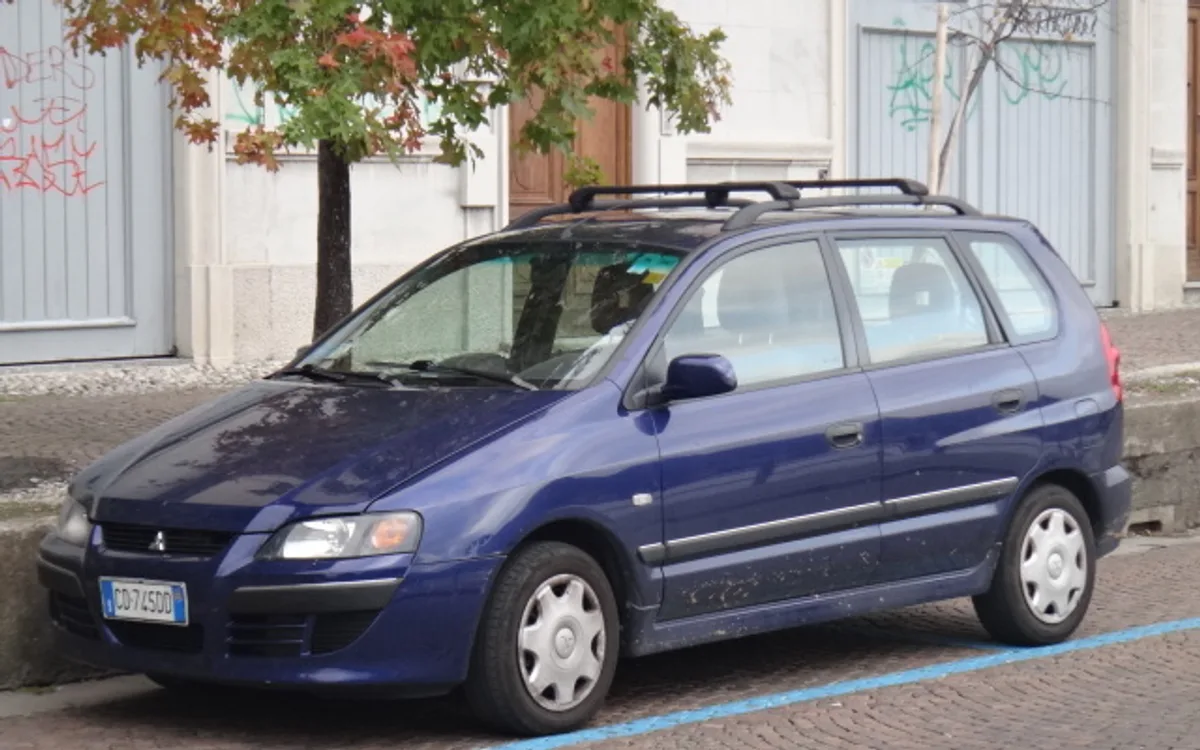
28.1%Mitsubishi Space Star
2,861 tests · 90,006 avg mi · 57.0% pass
Suspension faults account for 28.1% of the Space Star's MOT tests, across a fleet averaging 90k miles. The most common recorded suspension failures are The strength or continuity of the load bearing structure within 30cm of any sub-frame, spring or suspension component mounting (a 'prescribed area') is significantly reduced or inadequately repaired and a torn suspension dust cover. A first-time pass rate of 57.0% and a 4.6% pass-after-rectification rate together suggest suspension faults here are often caught and sorted rather than terminal.
- 04

 27.4%
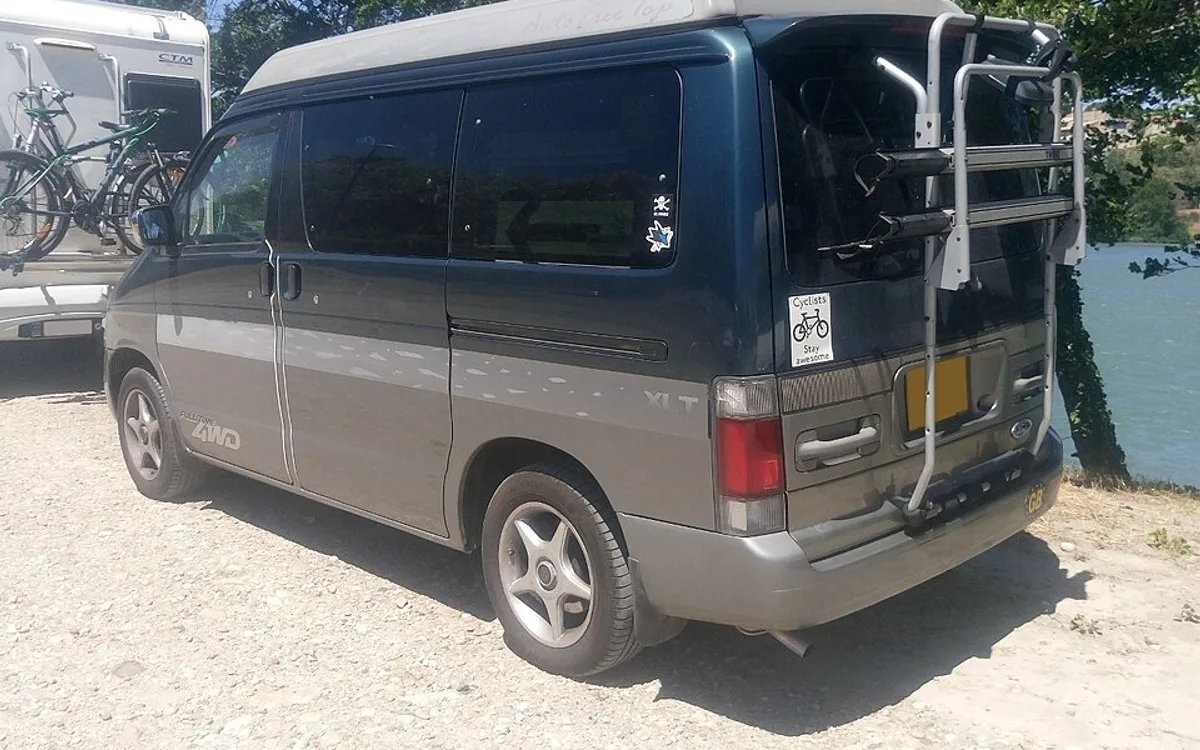
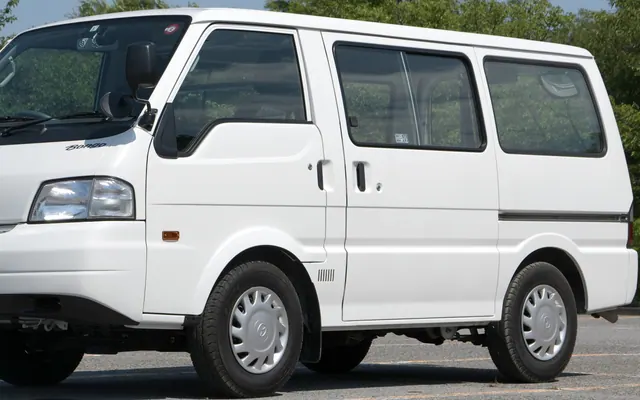
27.4%Ford Freda
1,716 tests · 142,691 avg mi · 62.2% pass
Suspension faults account for 27.4% of the Freda's MOT tests, across a fleet averaging 143k miles. The most common recorded suspension failures are The strength or continuity of the load bearing structure within 30cm of any sub-frame, spring or suspension component mounting (a 'prescribed area') is significantly reduced or inadequately repaired and a torn suspension dust cover. A first-time pass rate of 62.2% and a 4.0% pass-after-rectification rate together suggest suspension faults here are often caught and sorted rather than terminal.
- 05

 26.1%
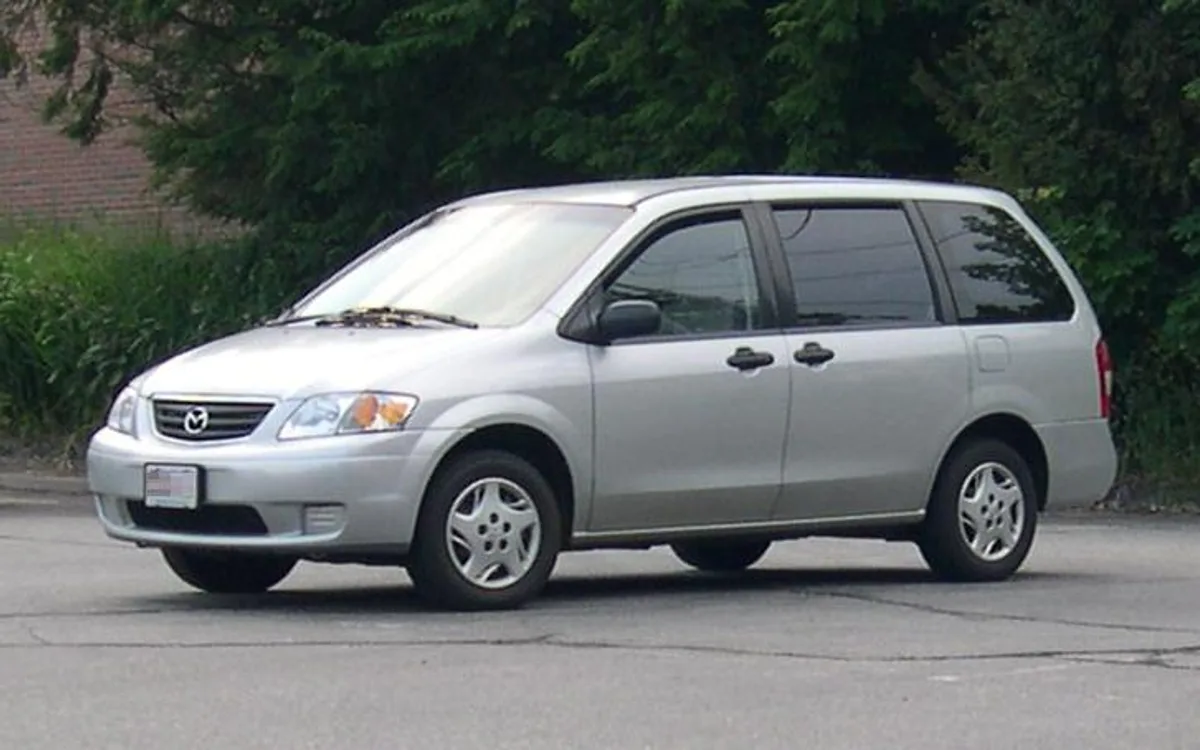
26.1%Mazda Mpv
1,374 tests · 142,668 avg mi · 58.5% pass
Suspension faults account for 26.1% of the Mpv's MOT tests, across a fleet averaging 143k miles. The most common recorded suspension failures are The strength or continuity of the load bearing structure within 30cm of any sub-frame, spring or suspension component mounting (a 'prescribed area') is significantly reduced or inadequately repaired and a torn suspension dust cover. A first-time pass rate of 58.5% and a 5.6% pass-after-rectification rate together suggest suspension faults here are often caught and sorted rather than terminal.
- 06
 25.2%
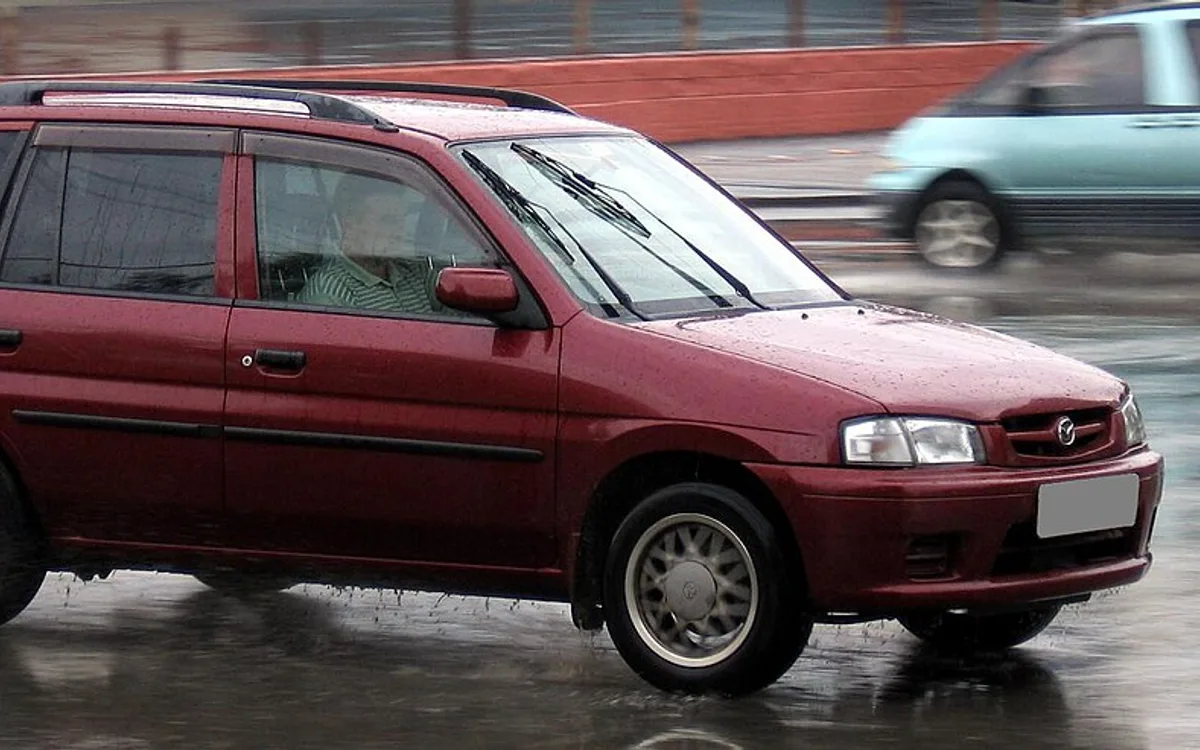
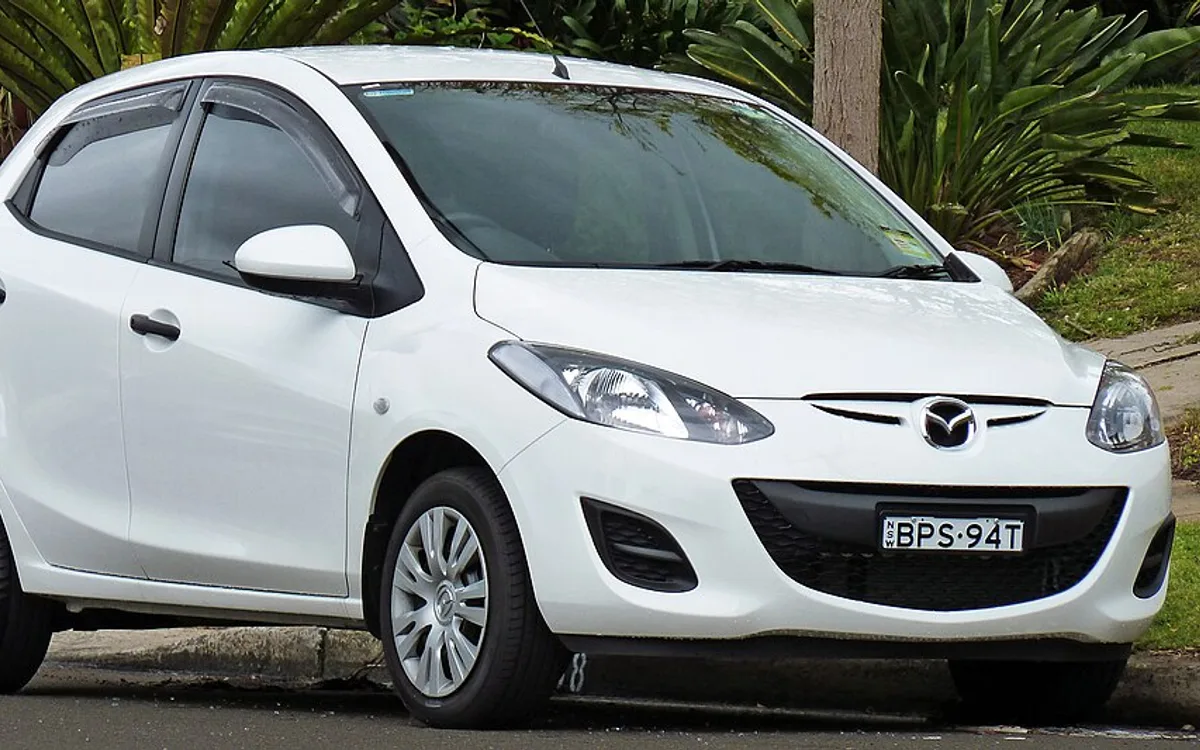
25.2%Mazda Demio
1,300 tests · 69,676 avg mi · 71.1% pass
Suspension faults account for 25.2% of the Demio's MOT tests, across a fleet averaging 70k miles. The most common recorded suspension failures are The strength or continuity of the load bearing structure within 30cm of any sub-frame, spring or suspension component mounting (a 'prescribed area') is significantly reduced or inadequately repaired and a torn suspension dust cover. A first-time pass rate of 71.1% and a 3.5% pass-after-rectification rate together suggest suspension faults here are often caught and sorted rather than terminal.
- 07

 25.1%
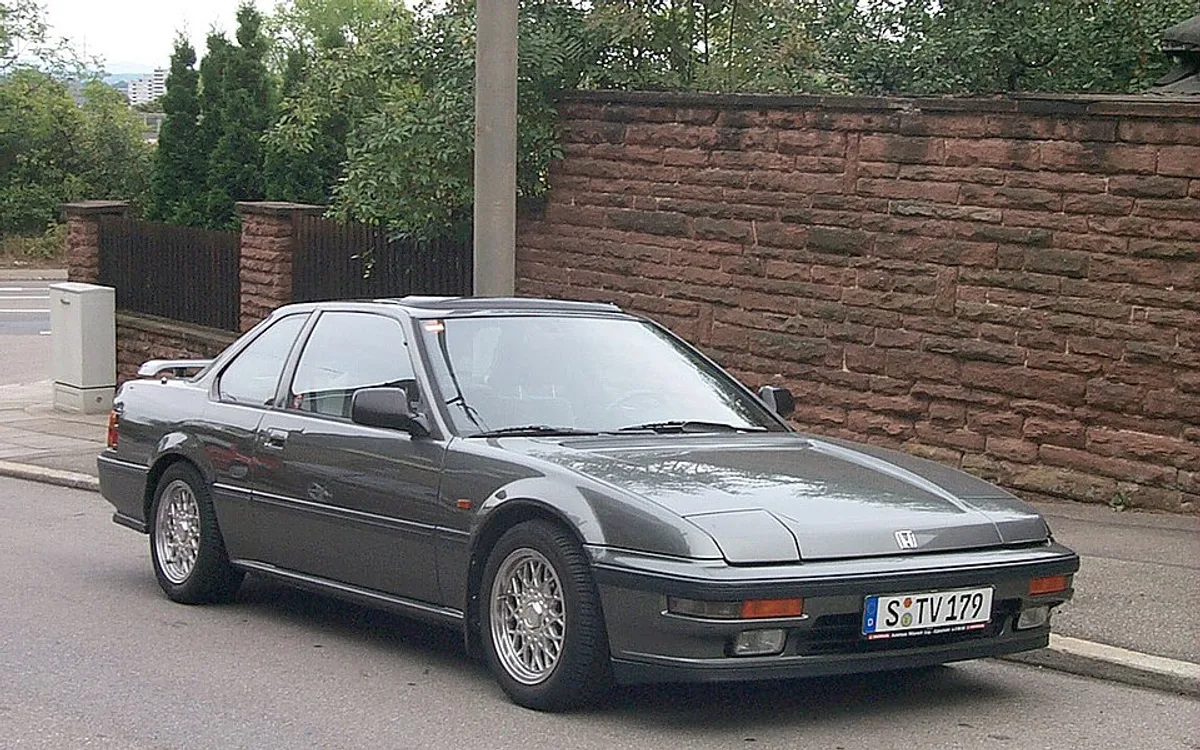
25.1%Honda Prelude
2,931 tests · 107,350 avg mi · 71.8% pass
Suspension faults account for 25.1% of the Prelude's MOT tests, across a fleet averaging 107k miles. The most common recorded suspension failures are a torn suspension dust cover and The strength or continuity of the load bearing structure within 30cm of any sub-frame, spring or suspension component mounting (a 'prescribed area') is significantly reduced or inadequately repaired. A first-time pass rate of 71.8% and a 3.2% pass-after-rectification rate together suggest suspension faults here are often caught and sorted rather than terminal.
- 08

 25.1%
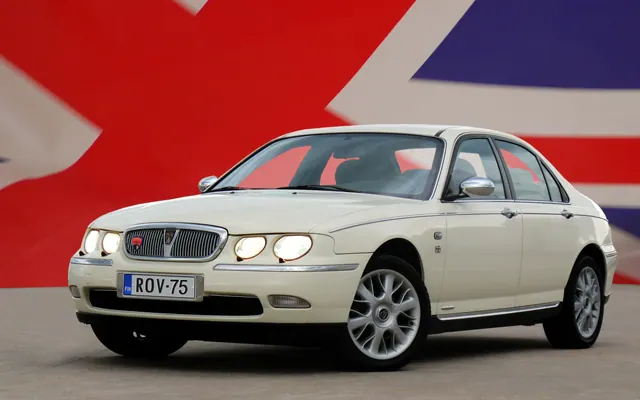
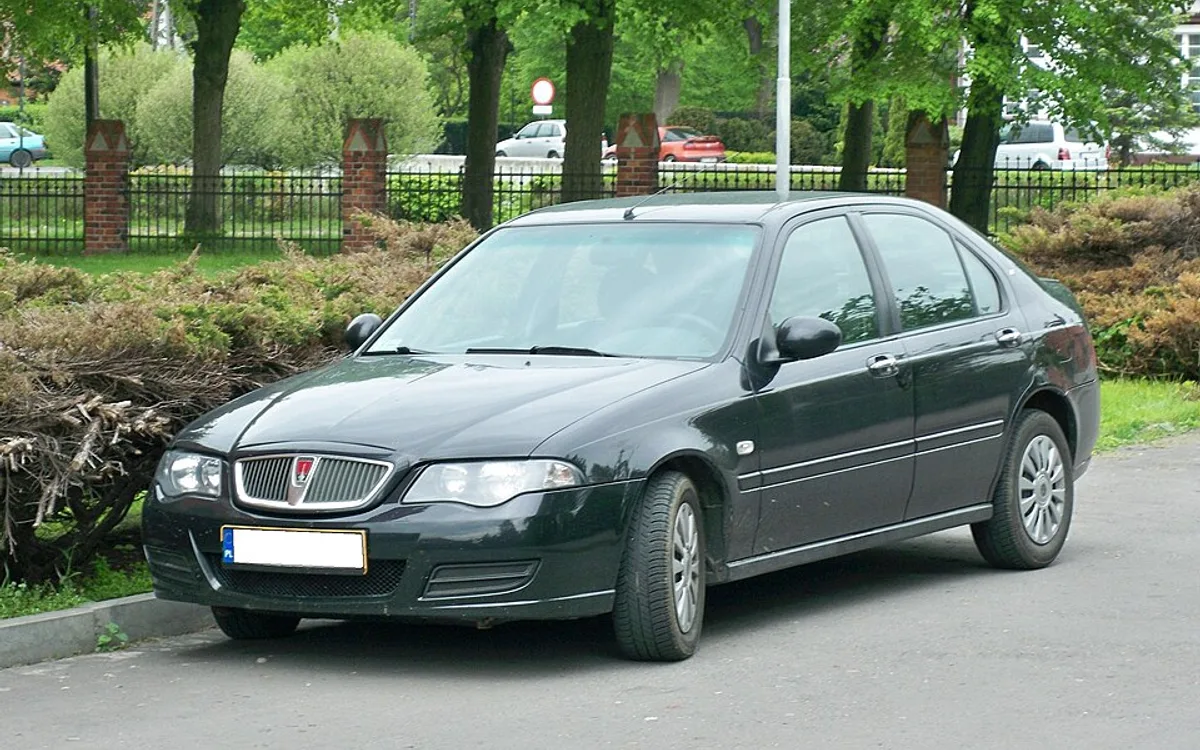
25.1%Rover 75
14,438 tests · 105,162 avg mi · 67.1% pass
Suspension faults account for 25.1% of the 75's MOT tests, across a fleet averaging 105k miles. The most common recorded suspension failures are The strength or continuity of the load bearing structure within 30cm of any sub-frame, spring or suspension component mounting (a 'prescribed area') is significantly reduced or inadequately repaired and worn suspension bushes. A first-time pass rate of 67.1% and a 4.1% pass-after-rectification rate together suggest suspension faults here are often caught and sorted rather than terminal.
- 09

 23.9%
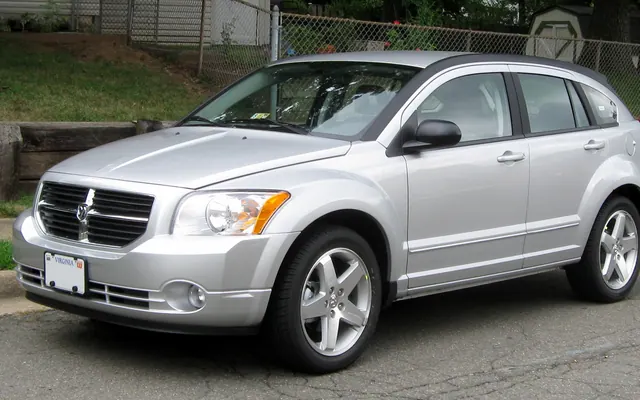
23.9%Dodge Caliber
1,770 tests · 95,588 avg mi · 57.7% pass
Suspension faults account for 23.9% of the Caliber's MOT tests, across a fleet averaging 96k miles. The most common recorded suspension failures are worn suspension bushes and worn suspension bushes. A first-time pass rate of 57.7% and a 6.3% pass-after-rectification rate together suggest suspension faults here are often caught and sorted rather than terminal.
- 10

 23.4%
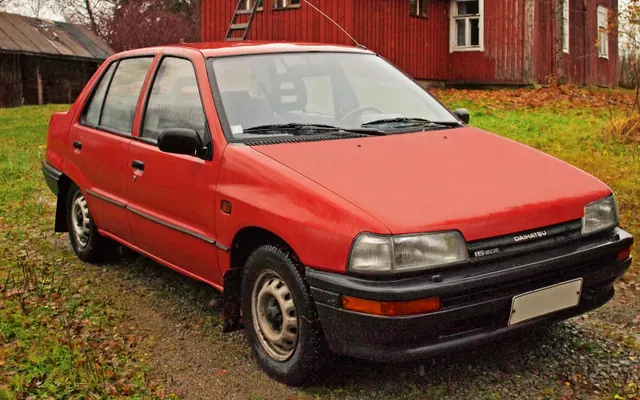
23.4%Daihatsu Charade
2,315 tests · 63,060 avg mi · 65.4% pass
Suspension faults account for 23.4% of the Charade's MOT tests, across a fleet averaging 63k miles. The most common recorded suspension failures are The strength or continuity of the load bearing structure within 30cm of any sub-frame, spring or suspension component mounting (a 'prescribed area') is significantly reduced or inadequately repaired and a torn suspension dust cover. A first-time pass rate of 65.4% and a 4.4% pass-after-rectification rate together suggest suspension faults here are often caught and sorted rather than terminal.
- 11
 22.0%
22.0%Mazda Bongo
19,244 tests · 132,505 avg mi · 64.8% pass
Suspension faults account for 22.0% of the Bongo's MOT tests, across a fleet averaging 133k miles. The most common recorded suspension failures are The strength or continuity of the load bearing structure within 30cm of any sub-frame, spring or suspension component mounting (a 'prescribed area') is significantly reduced or inadequately repaired and a torn suspension dust cover. A first-time pass rate of 64.8% and a 4.0% pass-after-rectification rate together suggest suspension faults here are often caught and sorted rather than terminal.
- 12

 21.4%
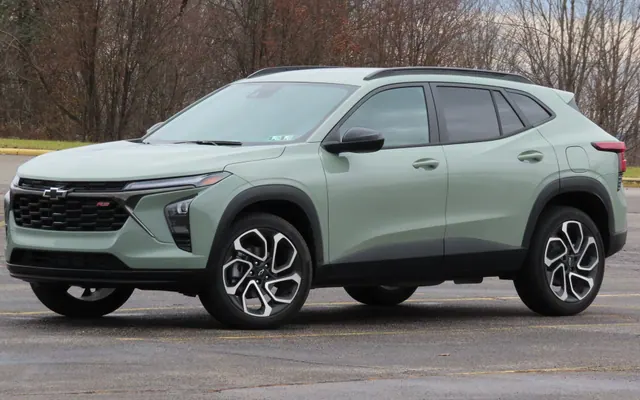
21.4%Chevrolet Trax
2,830 tests · 82,171 avg mi · 72.7% pass
Suspension faults account for 21.4% of the Trax's MOT tests, across a fleet averaging 82k miles. The most common recorded suspension failures are a torn suspension dust cover and a missing suspension dust cover. A first-time pass rate of 72.7% and a 3.5% pass-after-rectification rate together suggest suspension faults here are often caught and sorted rather than terminal.
- 13

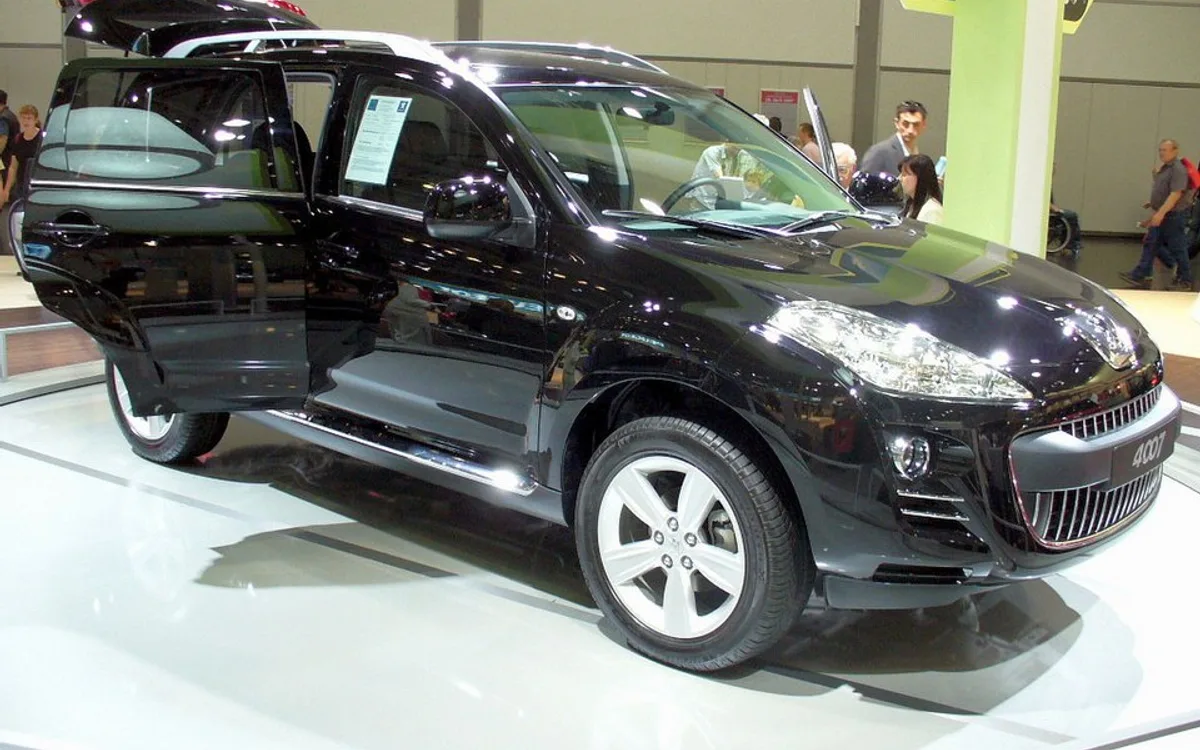 20.8%
20.8%Peugeot 4007
2,840 tests · 124,668 avg mi · 66.6% pass
Suspension faults account for 20.8% of the 4007's MOT tests, across a fleet averaging 125k miles. The most common recorded suspension failures are a torn suspension dust cover and worn suspension bushes. A first-time pass rate of 66.6% and a 5.2% pass-after-rectification rate together suggest suspension faults here are often caught and sorted rather than terminal.
- 14
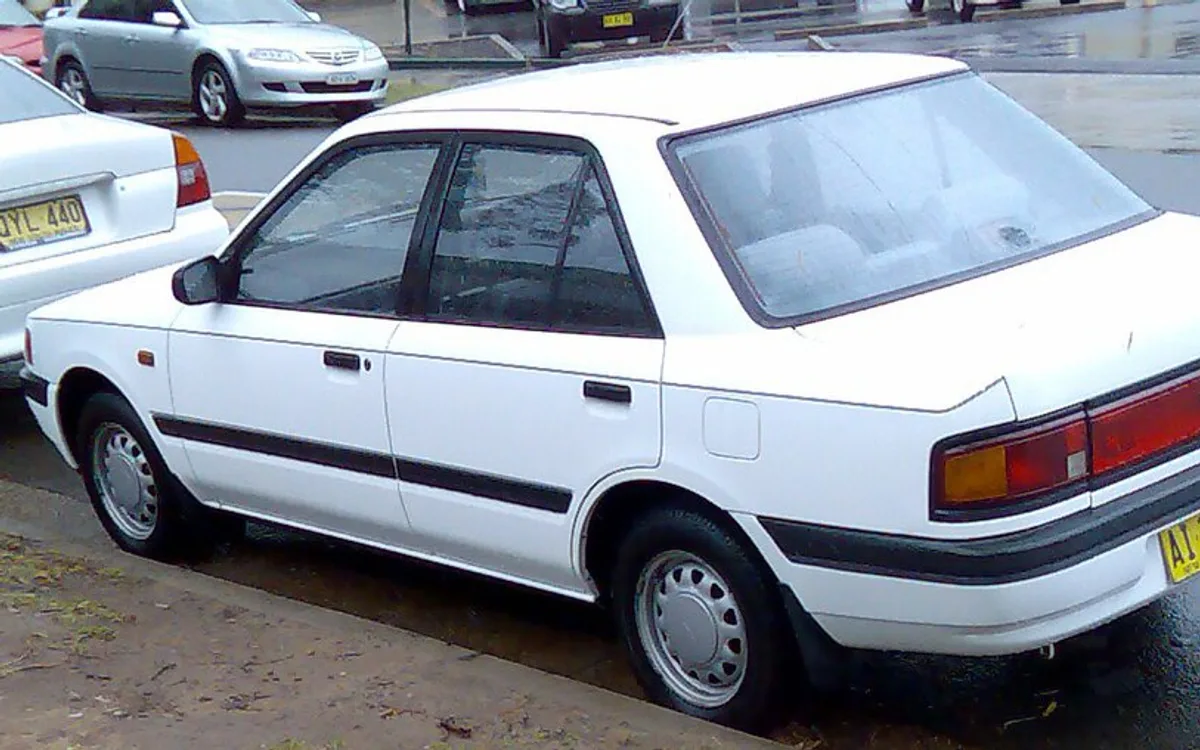 20.7%
20.7%Mazda 323
3,400 tests · 84,698 avg mi · 66.5% pass
Suspension faults account for 20.7% of the 323's MOT tests, across a fleet averaging 85k miles. The most common recorded suspension failures are The strength or continuity of the load bearing structure within 30cm of any sub-frame, spring or suspension component mounting (a 'prescribed area') is significantly reduced or inadequately repaired and a torn suspension dust cover. A first-time pass rate of 66.5% and a 4.2% pass-after-rectification rate together suggest suspension faults here are often caught and sorted rather than terminal.
- 15
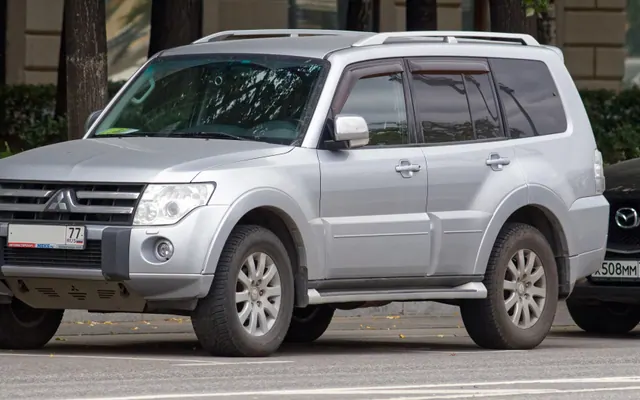 19.9%
19.9%Mitsubishi Shogun Pinin
2,505 tests · 84,855 avg mi · 62.2% pass
Suspension faults account for 19.9% of the Shogun Pinin's MOT tests, across a fleet averaging 85k miles. The primary suspension fault on record is The strength or continuity of the load bearing structure within 30cm of any sub-frame, spring or suspension component mounting (a 'prescribed area') is significantly reduced or inadequately repaired. Owner-flagged: Land Rover Discovery runs rings around it on the road for refinement…
- 16
 19.8%
19.8%Mitsubishi Carisma
1,533 tests · 107,125 avg mi · 61.8% pass
Suspension faults account for 19.8% of the Carisma's MOT tests, across a fleet averaging 107k miles. The most common recorded suspension failures are a torn suspension dust cover and worn suspension bushes. A first-time pass rate of 61.8% and a 4.8% pass-after-rectification rate together suggest suspension faults here are often caught and sorted rather than terminal.
- 17
 19.3%
19.3%Mazda Unclassified
2,355 tests · 125,686 avg mi · 66.4% pass
Suspension faults account for 19.3% of the Unclassified's MOT tests, across a fleet averaging 126k miles. The most common recorded suspension failures are The strength or continuity of the load bearing structure within 30cm of any sub-frame, spring or suspension component mounting (a 'prescribed area') is significantly reduced or inadequately repaired and a torn suspension dust cover. A first-time pass rate of 66.4% and a 3.3% pass-after-rectification rate together suggest suspension faults here are often caught and sorted rather than terminal.
- 18

 19.1%
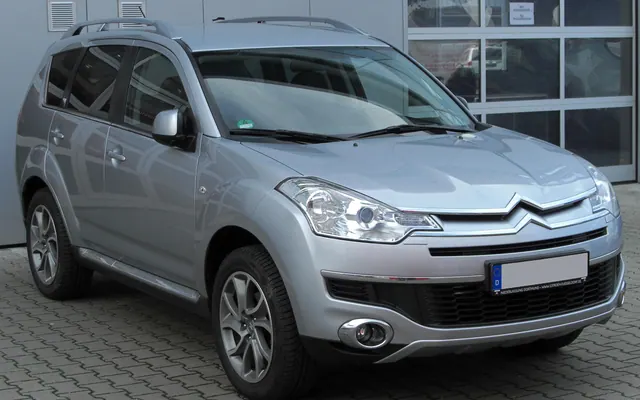
19.1%Citroen C Crosser
3,514 tests · 126,729 avg mi · 67.7% pass
Suspension faults account for 19.1% of the C Crosser's MOT tests, across a fleet averaging 127k miles. The most common recorded suspension failures are a torn suspension dust cover and worn suspension bushes. A first-time pass rate of 67.7% and a 4.3% pass-after-rectification rate together suggest suspension faults here are often caught and sorted rather than terminal.
- 19

 18.9%
18.9%Mercedes Benz C 320
2,602 tests · 118,002 avg mi · 73.1% pass
Suspension faults account for 18.9% of the C 320's MOT tests, across a fleet averaging 118k miles. The most common recorded suspension failures are worn suspension bushes and a broken or weak spring. Owner-flagged: C220 CDI with automatic gearbox is disappointing. Surprising quality issues with pre-facelift…
- 20
 18.9%
18.9%Daihatsu Terios
7,322 tests · 91,189 avg mi · 67.2% pass
Suspension faults account for 18.9% of the Terios's MOT tests, across a fleet averaging 91k miles. The most common recorded suspension failures are The strength or continuity of the load bearing structure within 30cm of any sub-frame, spring or suspension component mounting (a 'prescribed area') is significantly reduced or inadequately repaired and a torn suspension dust cover. A first-time pass rate of 67.2% and a 4.1% pass-after-rectification rate together suggest suspension faults here are often caught and sorted rather than terminal.
- 21
 18.7%
18.7%Mercedes Benz Clc
17,645 tests · 101,320 avg mi · 68.6% pass
Suspension faults account for 18.7% of the Clc's MOT tests, across a fleet averaging 101k miles. The most common recorded suspension failures are worn suspension bushes and a broken or weak spring. A first-time pass rate of 68.6% and a 4.7% pass-after-rectification rate together suggest suspension faults here are often caught and sorted rather than terminal.
- 22

 18.3%
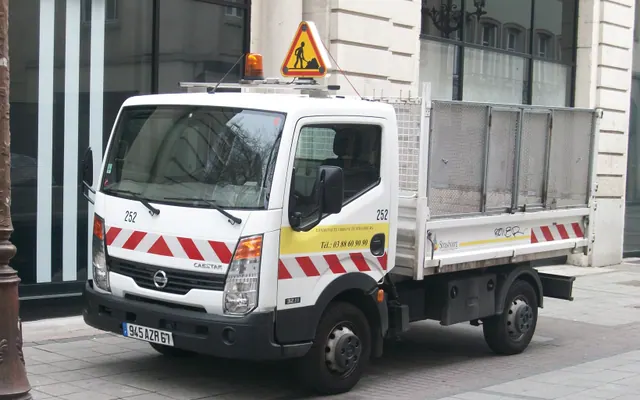
18.3%Nissan Cabstar
20,515 tests · 91,710 avg mi · 61.7% pass
Suspension faults account for 18.3% of the Cabstar's MOT tests, across a fleet averaging 92k miles. The most common recorded suspension failures are worn suspension bushes and a worn shock-absorber bush. A first-time pass rate of 61.7% and a 4.2% pass-after-rectification rate together suggest suspension faults here are often caught and sorted rather than terminal.
- 23

 18.2%
18.2%Daewoo Matiz
1,838 tests · 57,123 avg mi · 57.6% pass
Suspension faults account for 18.2% of the Matiz's MOT tests, across a fleet averaging 57k miles. The most common recorded suspension failures are The strength or continuity of the load bearing structure within 30cm of any sub-frame, spring or suspension component mounting (a 'prescribed area') is significantly reduced or inadequately repaired and worn suspension bushes. A first-time pass rate of 57.6% and a 5.2% pass-after-rectification rate together suggest suspension faults here are often caught and sorted rather than terminal.
- 24
 18.1%
18.1%Jaguar XK
18,931 tests · 64,885 avg mi · 84.8% pass
Suspension faults account for 18.1% of the XK's MOT tests, across a fleet averaging 65k miles. The most common recorded suspension failures are a torn suspension dust cover and a missing suspension dust cover. With a 84.8% first-time pass rate, these suspension faults are worth factoring into any used-car budget as likely near-term costs.
- 25
 18.0%
18.0%Honda FR V
13,692 tests · 128,245 avg mi · 63.8% pass
Suspension faults account for 18.0% of the FR V's MOT tests, across a fleet averaging 128k miles. The most common recorded suspension failures are a torn suspension dust cover and The strength or continuity of the load bearing structure within 30cm of any sub-frame, spring or suspension component mounting (a 'prescribed area') is significantly reduced or inadequately repaired. A first-time pass rate of 63.8% and a 7.2% pass-after-rectification rate together suggest suspension faults here are often caught and sorted rather than terminal.
- 26
 17.5%
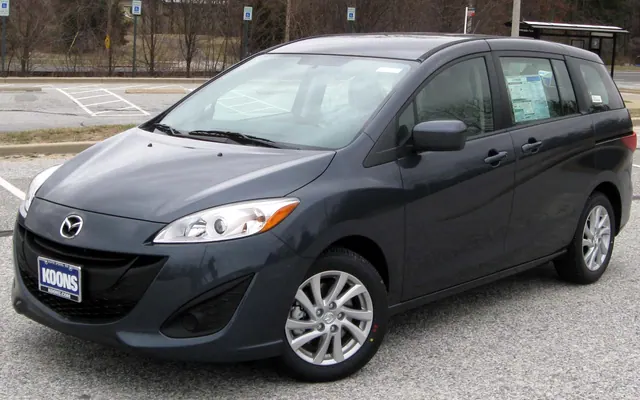
17.5%Mazda 5
20,585 tests · 105,526 avg mi · 63.4% pass
Suspension faults account for 17.5% of the 5's MOT tests, across a fleet averaging 106k miles. The most common recorded suspension failures are worn suspension bushes and worn suspension bushes. Owner-flagged: Phantom fault with 2012/62 Ma
- 27
 17.3%
17.3%Mazda E Series
1,837 tests · 118,430 avg mi · 67.3% pass
Suspension faults account for 17.3% of the E Series's MOT tests, across a fleet averaging 118k miles. The most common recorded suspension failures are The strength or continuity of the load bearing structure within 30cm of any sub-frame, spring or suspension component mounting (a 'prescribed area') is significantly reduced or inadequately repaired and a torn suspension dust cover. A first-time pass rate of 67.3% and a 3.5% pass-after-rectification rate together suggest suspension faults here are often caught and sorted rather than terminal.
- 28
 17.3%
17.3%Rover 45
3,677 tests · 80,022 avg mi · 64.9% pass
Suspension faults account for 17.3% of the 45's MOT tests, across a fleet averaging 80k miles. The most common recorded suspension failures are The strength or continuity of the load bearing structure within 30cm of any sub-frame, spring or suspension component mounting (a 'prescribed area') is significantly reduced or inadequately repaired and a torn suspension dust cover. A first-time pass rate of 64.9% and a 5.2% pass-after-rectification rate together suggest suspension faults here are often caught and sorted rather than terminal.
- 29
 17.1%
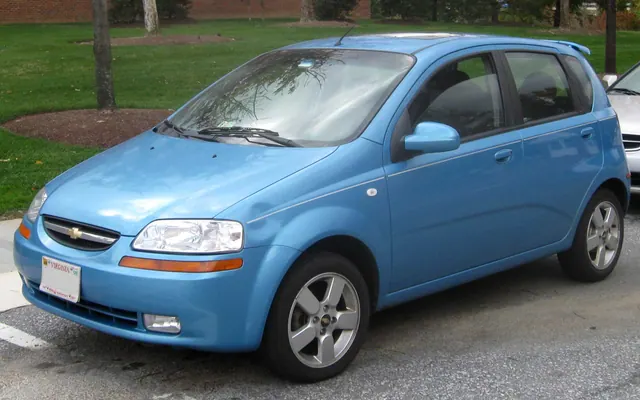
17.1%Chevrolet Kalos
4,779 tests · 68,190 avg mi · 59.5% pass
Suspension faults account for 17.1% of the Kalos's MOT tests, across a fleet averaging 68k miles. The most common recorded suspension failures are The strength or continuity of the load bearing structure within 30cm of any sub-frame, spring or suspension component mounting (a 'prescribed area') is significantly reduced or inadequately repaired and worn suspension bushes. A first-time pass rate of 59.5% and a 5.9% pass-after-rectification rate together suggest suspension faults here are often caught and sorted rather than terminal.
- 30

 16.8%
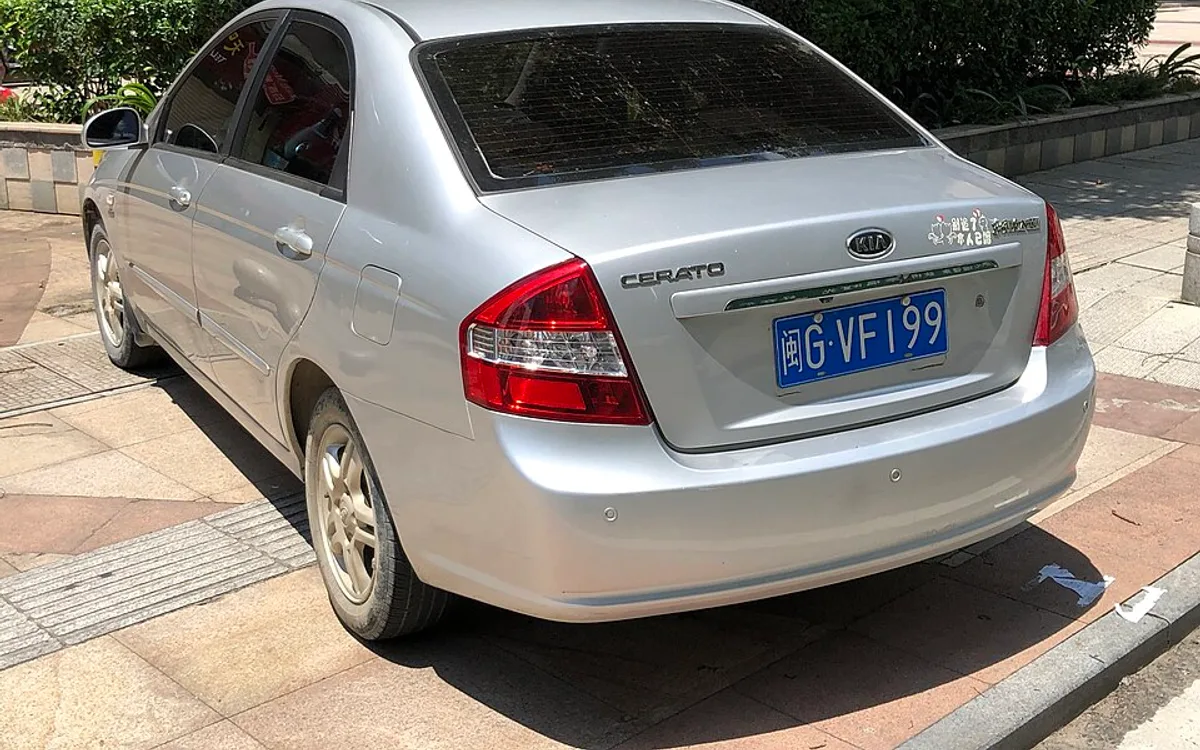
16.8%Kia Cerato
1,470 tests · 88,409 avg mi · 60.7% pass
Suspension faults account for 16.8% of the Cerato's MOT tests, across a fleet averaging 88k miles. The most common recorded suspension failures are The strength or continuity of the load bearing structure within 30cm of any sub-frame, spring or suspension component mounting (a 'prescribed area') is significantly reduced or inadequately repaired and worn suspension bushes. A first-time pass rate of 60.7% and a 4.9% pass-after-rectification rate together suggest suspension faults here are often caught and sorted rather than terminal.
My Motor World · affiliate
Parts & supplies for this fix
Affiliate links — small commission, no extra cost to you.

QH
Quinton Hazell EMB2643 Stabiliser Bar Bush
£2.19
View at My Motor World →

QH
Quinton Hazell EMB2644 Stabiliser Bar Bush
£2.19
View at My Motor World →

QH
Quinton Hazell EMB7041 Stabiliser Bar Bush
£2.19
View at My Motor World →

QH
Quinton Hazell EMB7057 Stabiliser Link Bush
£2.19
View at My Motor World →
Click Mechanic · affiliate
Book a mobile mechanic
Affiliate links — small commission, no extra cost to you.
Mobile mechanic · UK-wide
Book a mechanic at your door.
Fixed-price quotes upfront. No garage needed. Click Mechanic sends a vetted local mechanic to you — home, work, or roadside.